Stock market declines can feel alarming for just about everyone – no matter how seasoned an investor you are or how long your time horizon. A major reason is our own internal hardwiring. Psychological research suggests that we feel the pain of a loss twice as much as the pleasure of a gain.
|
KEY TAKEAWAYS
|
This means the market can rise for years with barely a shrug. But then investors experience a heightened sense of alarm when the market suddenly drops. Add in the media euphoria that tends to follow, and it feels as if every negative return is uniquely bad in its own way. It brings to mind the famous Russian novelist Leo Tolstoy who wrote: “Happy families are all alike; every unhappy family is unhappy in its own way.”
However, a look at market history shows that “unhappy markets” are not so unique after all. They are an ordinary feature of the stock market cycle.
In times of high market volatility, a look at the past can provide an important outlook to help investors stay focused on the long-term possibilities rather than the short-term challenges.
So, here are some charts that show a big picture view of the stock market, including the frequency of market volatility, corrections and bear markets, and offer a sober perspective during times when everything seems to be going crazy.
Market volatility is the norm
Over the short term, the stock market constantly rises and falls. Consider that the average pullback in stocks each year has been 14.0% over the past 42 years, as shown in this chart. Yet, annual stock returns were positive at the end of 32 of those 42 years – that’s 76% of the time!
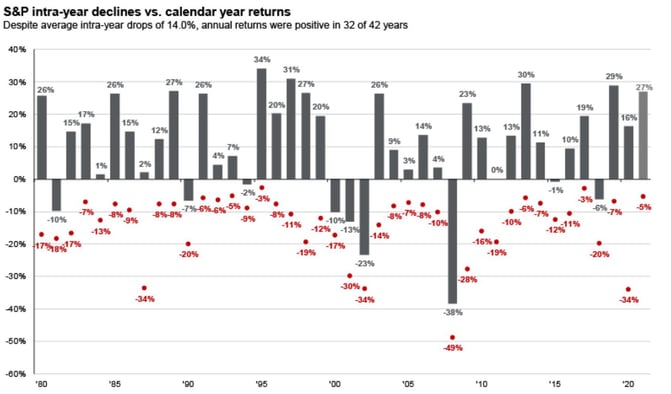
Source: JP Morgan
While stocks and other investments are typically volatile in the short term, they are relatively stable over the long term. As you can see in the following chart, the difference between the highs and lows shrinks over time.
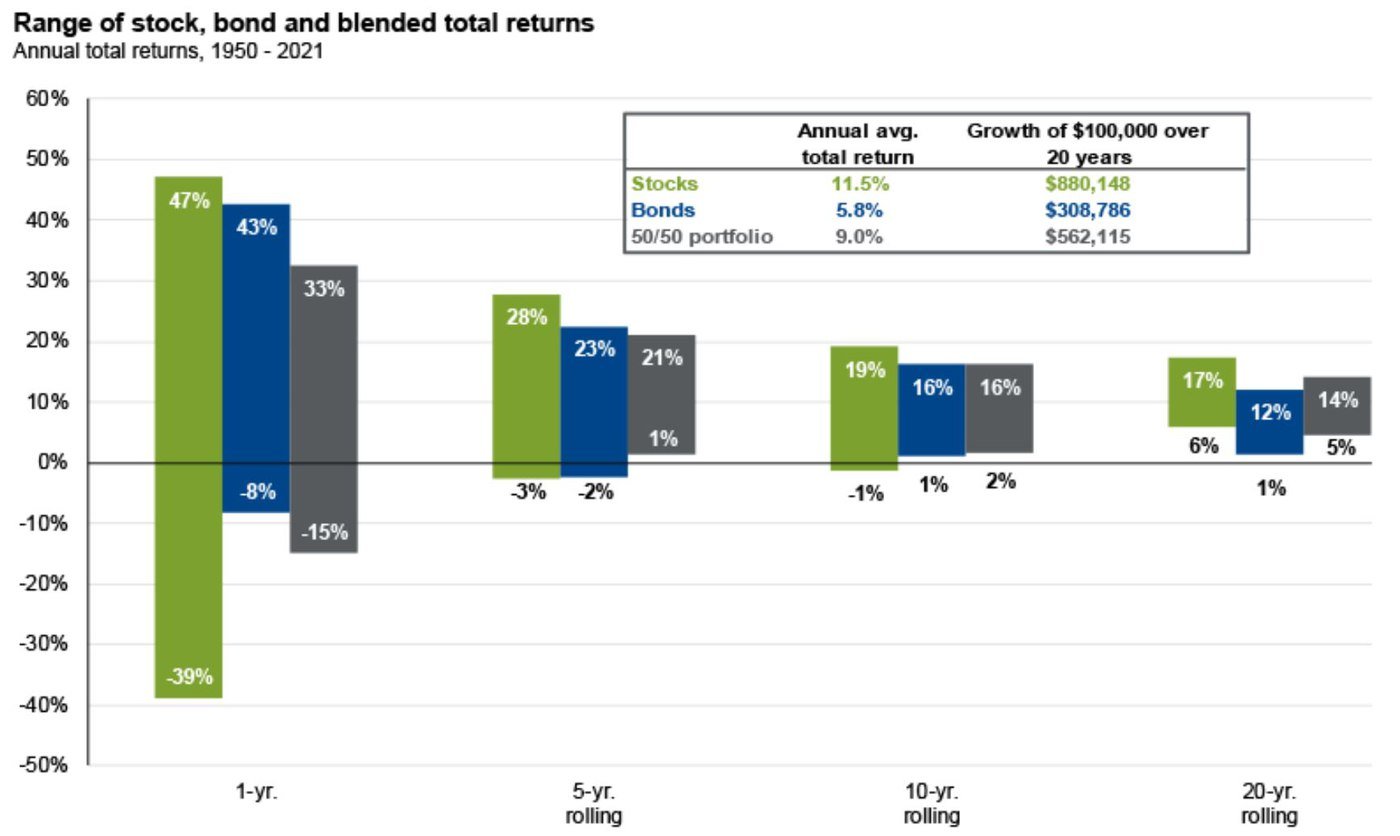
Source: JP Morgan
These charts emphasize the importance of keeping a long-term perspective. Focus not on stock market volatility, but rather volatility in your portfolio. Diversification – holding investments that behave independently of stocks – can help reduce the impact of stock market turbulence and provide a better chance at participating in positive returns from investments that are up when stocks are down.
Market corrections are pretty common and don’t last long
Although every market drop can feel unique, the history told in this chart tells us they’re more common than we may remember.
A decline of 5% or more occurs about three times a year, and the market returns to its previous peak on average in just 43 days. Meanwhile, we can expect a market correction, which is defined as a decline of 10% or more, to happen about once a year.
Much less frequent are market declines of 20% or more, commonly known as a bear market, which tend to happen about once every six years.
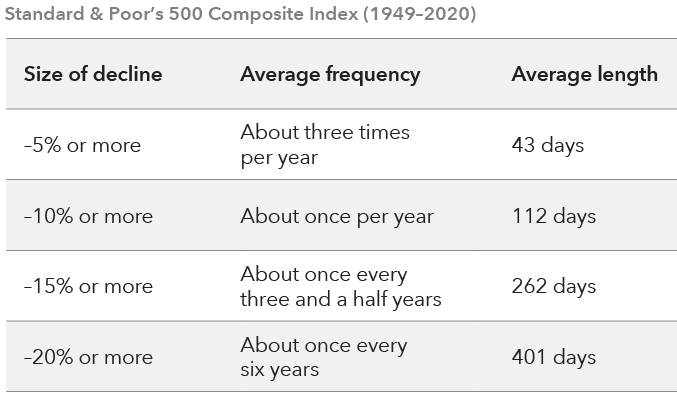
Source: Capital Group
Ultimately, the risk of a decline is a feature of stock investing, not a bug. It is why investors are rewarded for holding stocks in their portfolios.
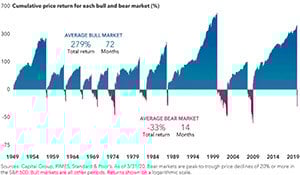
Bear markets are relatively rare and weak compared to bull markets
Over market history, bears don’t venture out of hibernation all that much. And, when they do, they tend to be short lived compared to bull markets. This chart going back to 1949 shows the average bear market has lasted 14 months with a total return of -33%. Compare that to the average bull market, which has lasted 72 months with a total return of 279%.

Source: Capital Group
Markets often recover quickly and strongly
The stock market has recovered from every past downturn. What’s more, those recoveries have been periods of strong positive returns, as detailed in this chart.
Returns in the first year after the five biggest market declines since 1929 averaged 71%, ranging from 36% to 138%. The average value of a hypothetical investment would have more than doubled over the five years after each market low.
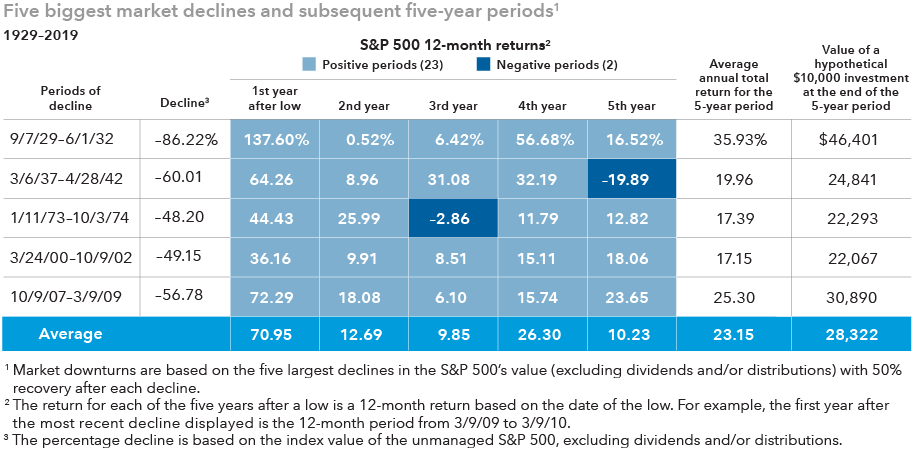
Source: Capital Group
Moral of the story: Don’t miss out on potential rebounds. This is why investors should generally avoid any dramatic, wholesale changes to their investments in a down market. Taking money out of the market could mean missing the full benefit of the market recovery.
The market has seen “it” before
The stock market has been through a lot. While the event that causes the next downturn may seem unique, it’s important to remember there have been many past events that have been just as bad, if not worse. Through it all, the stock market has persevered.
This chart shows the remarkable rise of $1 invested in the stock market, from the Great Depression on through World War II, undeterred by the Cold War and 2008 financial crisis, and up to the Covid pandemic.
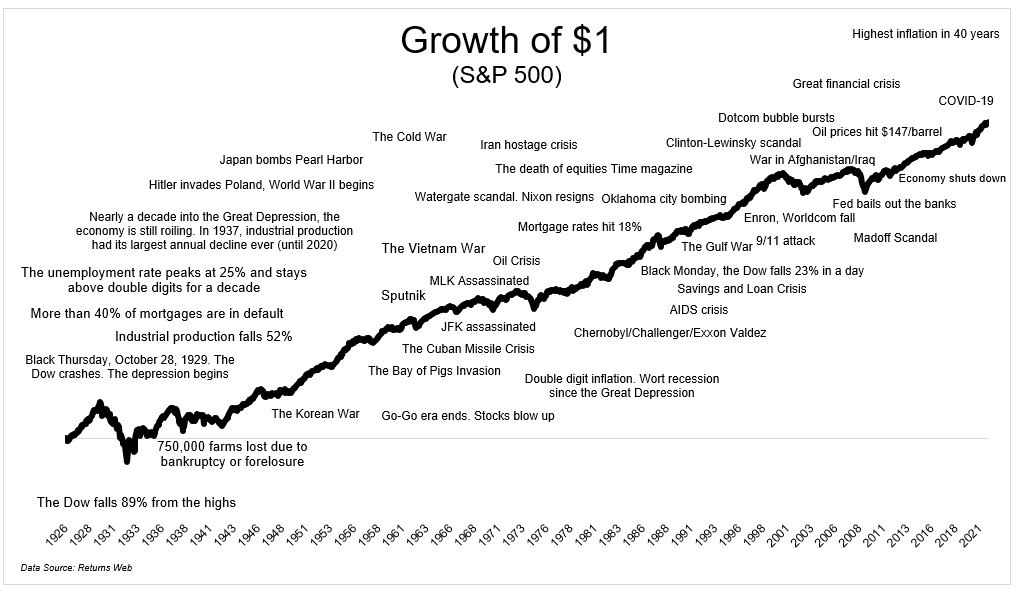
Source: Irrelevant Investor
Although the past is no indication of the future, it is reasonable to invest with the optimism that nations and their industries and capital markets will carry on. And, you as an investor, can take part of that progress over many years to build your own wealth.
Stay on track toward your financial goals during times of market turbulence. Download our guide: "How to Survive a Market Downturn"